Appearance

Executive summary: In a polycephalous organization, Data Governance is a complex challenge. This article explores the implementation of a Data Platform based on Dagster for the Fédération Wallonie-Bruxelles (FWB). It highlights the importance of automation, modularity, and component reusability to lower the technical barrier and improve data literacy among data analysts and data stewards.
The views expressed on this website are my own and do not necessarily reflect the views of my employer.
Table of contents
If you want to encourage data analysts and data stewards to participate in the development of data pipelines, you need to ensure every commit is tested and validated before being deployed to production. You also want to automate repetitive tasks to reduce the technical barrier as much as possible. In addition, you want to setup a solid observability system to monitor the health of your systems and data pipelines and detect issues early.
To explain how we automate the deployment of data pipelines, I will first describe the architecture of our data platform.
🏗️ Technical Architecture of our Data Platform
Our stack is currently based on the following components:
- Dagster: The orchestrator of our data pipelines. It allows us to define, schedule, and monitor our data workflows.
- dbt-core: The data transformation tool that allows us to define our data models and transformations in a modular way. It is used to build the data models and transformations that are executed by Dagster.
- DuckDB: The SQL engine that allows us to run SQL queries on our data. It is used for local development and testing of our data pipelines.
- Azure: The cloud provider that hosts our data platform. We use Azure Data Lake Storage (ADLS) for data storage.
- Docker: The containerization technology that allows us to package our data pipelines and their dependencies in a portable way.
- GitLab: The version control system that allows us to manage our code repositories and automate our CI/CD pipelines.
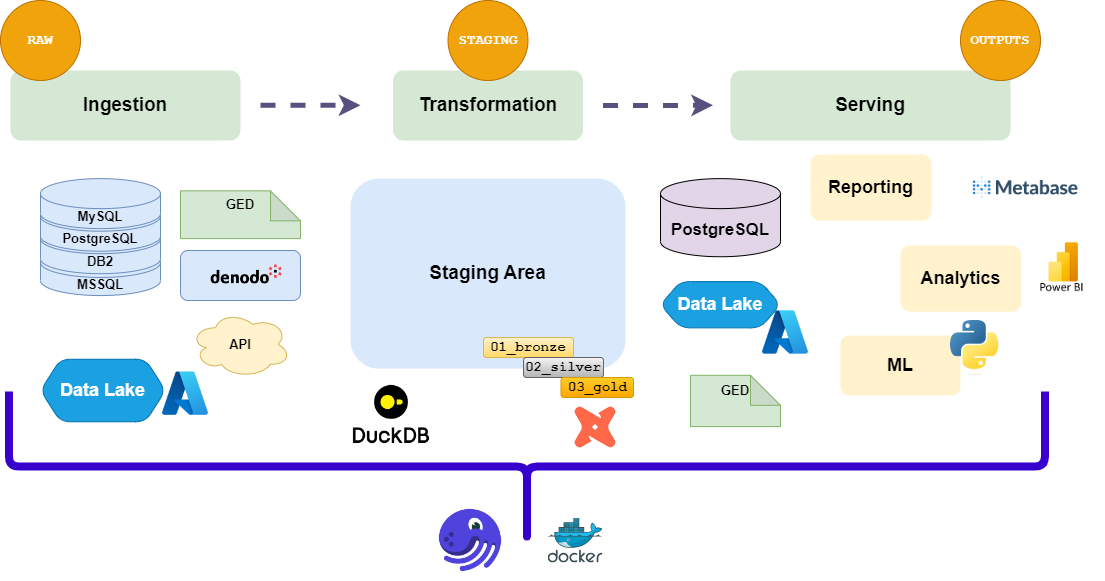
Data flow in our stack
One important side note here: our technical choices are not set in stone. We are constantly evaluating new technologies and approaches to improve our data platform. The goal is to provide a flexible and scalable architecture that can adapt to the changing needs of the organization. If dbt-core, Dagster, or any other tool/provider does not fit our needs anymore, we will not hesitate to change it. What we are really binding ourselves to is the (1) architecture, and the (2) languages we use to implement it (Python, SQL). The tools and providers are just means to an end.
For excellent recommendations on how to build a solid data platform, I recommend reading Fundamentals of Data Engineering by Joe Reis and Matt Housley.
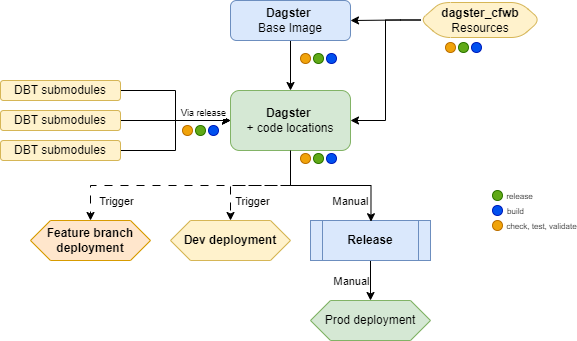
Code locations structure
To allow each administration générale (AG) to own its repository (a code location in Dagster vocabulary)—which contains the Dagster code location for the data pipelines of that AG—we decided to mirror the organizational structure of the FWB into the architecture of our data platform. We also use distinct code locations for specific projects that are not tied to a specific AG. This allows each AG to manage its own data pipelines independently and have clear ownership of the code. The code locations are then aggregated into a single Dagster instance, which is the data platform.
🗂️ Structure of our code locations folder
bash
dagster_home (main) $ tree -L 1
.
├── ags_project
├── agaj_project
...
├── data_platform # our generic code location
├── dagster.yaml
└── workspace.yaml
🤖 Automate CI/CD
CI/CD flow
Our deployment setup is based on GitLab CI/CD pipelines. The flow is as follows:
- Submodules integration: DBT projects are integrated as a Git submodule in the main repository. This allows us to include the work of data stewards and analysts in the data platform without having to duplicate code or maintain separate repositories.
- Build: The code is built and packaged into a Docker image; the same image is used for Webserver, Daemon, and Code locations.
- Validate definitions: The Dagster definitions are validated to ensure they are correct and do not contain any errors.
- Ruff: The code is checked for style and formatting issues using Ruff.
- Sonar: The code is analyzed for quality and security issues using SonarQube.
- Test: The code is tested using pytest for unit tests, integration tests, and coverage analysis.
- Deploy to DEV: The code is deployed to the development environment for each commit in the main branch or feature branch.
- Release: A new release is created in GitLab, a tag and a changelog are generated.
- Deploy to PROD: The code is deployed to the production environment.
Stack flow on Gitlab
Below is an example of how we implement this flow in our .gitlab-ci.yml file.
Validate definitions
yaml
# .gitlab-ci.yml
[...]
validate_definitions:
  stage: analyse
  allow_failure: false
  needs:
    - build
  image: gitlab.*/*/dagster:latest
  script:
    - cd /opt/dagster/dagster_home
    - rm dagster.yaml
    - dagster definitions validate -d code_location_1 -m code_location_1 // [!code focus]
    - dagster definitions validate -d code_location_2 -m code_location_2 // [!code focus]
    - ...
Sonar
yaml
# .gitlab-ci.yml
[...]
sonarqube:
  script:
    - SONAR_SCANNER_OPTS="${SONAR_SCANNER_OPTS} -Dsonar.exclusions=**/dbt_packages/**,**/dbt-*/**/*.sql,**/dbt-*/**/*.py"
    - sonar-scanner // [!code focus]
[...]
Pytest and coverage analysis
yaml
# .gitlab-ci.yml
[...]
test:
  stage: test
  script:
    - uv run coverage run -m pytest --tb=no // [!code focus]
    - uv run coverage xml -o coverage-reports/coverage.xml
    - uv run coverage report -m
  coverage: "/TOTAL\\s+.*?([0-9]{1,3})%/"
[...]
Our deployment setup
Once deployed, the data platform is composed of the following containerized components:
- A PostgreSQL database to store the Dagster data.
- A webserver to provide the UI and API for the data platform.
- A daemon to monitor the code and communicate with the code locations and the webserver.
- And a code location for each AG or specific project.
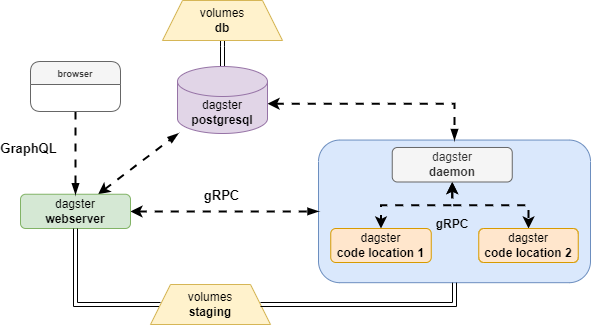
Container deployement
Automate integration of DBT
We created a specific release cycle for our DBT projects. This allows us to include the work of data stewards and analysts in the data platform while giving them full autonomy to develop their data models, transformations, and quality monitoring. The DBT projects are integrated as Git submodules in the main repository of the data platform.

dbt-core at FWB
For each commit in the main branch of the DBT project, models are analyzed by sqlfluff, and a GitLab page is published with the documentation of the DBT project that includes the data models, the tests, and the documentation of the data models. This allows us to have a clear overview of the data models and their dependencies and allows analysts to share this documentation with their colleagues.
When a new release is created, the DBT project is automatically versioned using the release tool. The version is bumped and a changelog is generated. The DBT project is then parsed using dbt parse to produce the manifest.json file, which contains the metadata of the DBT project. This file is used by Dagster to discover the DBT models and their dependencies.
The release cycle of our DBT projects consists of the following steps:
yaml
# .gitlab-ci.yml
sqlfluff:
  allow_failure: true
  script:
    - sqlfluff lint models

release:
  script:
    - VERSION=$(release next-version)
    - |
      sed -i "s/version: \"[^\"]*\"/version: \"$VERSION\"/" "$FILETOCHANGE"
    - release changelog
    - release commit-and-tag --create-tag-pipeline CHANGELOG.md ${DBT_PATH}/dbt_project.yml // [!code focus]

dagster_submodule:
  rules:
    - if: "$CI_COMMIT_TAG"
  script:
    [...]
    - git add .
    - git diff --cached --quiet || git commit -m "Update dbt submodule"  // [!code focus]
    # Push changes without forcing deletion
    - git push origin dagster_submodule // [!code focus]

# This step publishes an artifact for DBT docs.
pages:
  stage: dbt_docs
  only:
    - main
  script:
    [...]
    - dbt docs generate // [!code focus]
👀 Automate observability
The observability of our data platform is a key aspect of the implementation of a Data Platform. It allows us to monitor the health of our systems (1) and data pipelines (2), to detect issues early, and ensure the quality of our data (3).
Panopicon
Observability of our stack (containers)
For the observability of our systems, we use Kibana and Dozzle to monitor the logs and metrics of our data platform.
Observability of our data pipelines
Like a panopticon or a centralized observability hub, we use mainly MS Teams channel (accessible by all stakeholders) to centralize the observability of our data platform in a single place. Some custom notifications are also sent through NTFY and Email for specific events or alerts.
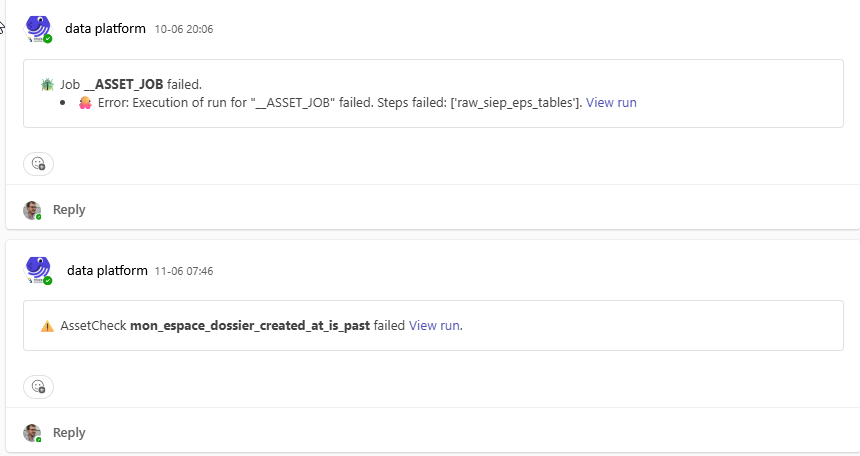
Observability of our data
For the observability of our data, we use the built-in features of Dagster to check the quality of our data. Dagster provides a set of observability features (custom or integrated) that allow us to monitor the health of our data pipelines and detect issues early.
Event without writing custom checks, Dagster UI allow us to monitor the quality of our data. Here is how we found a quality issue in one of our data pipelines:
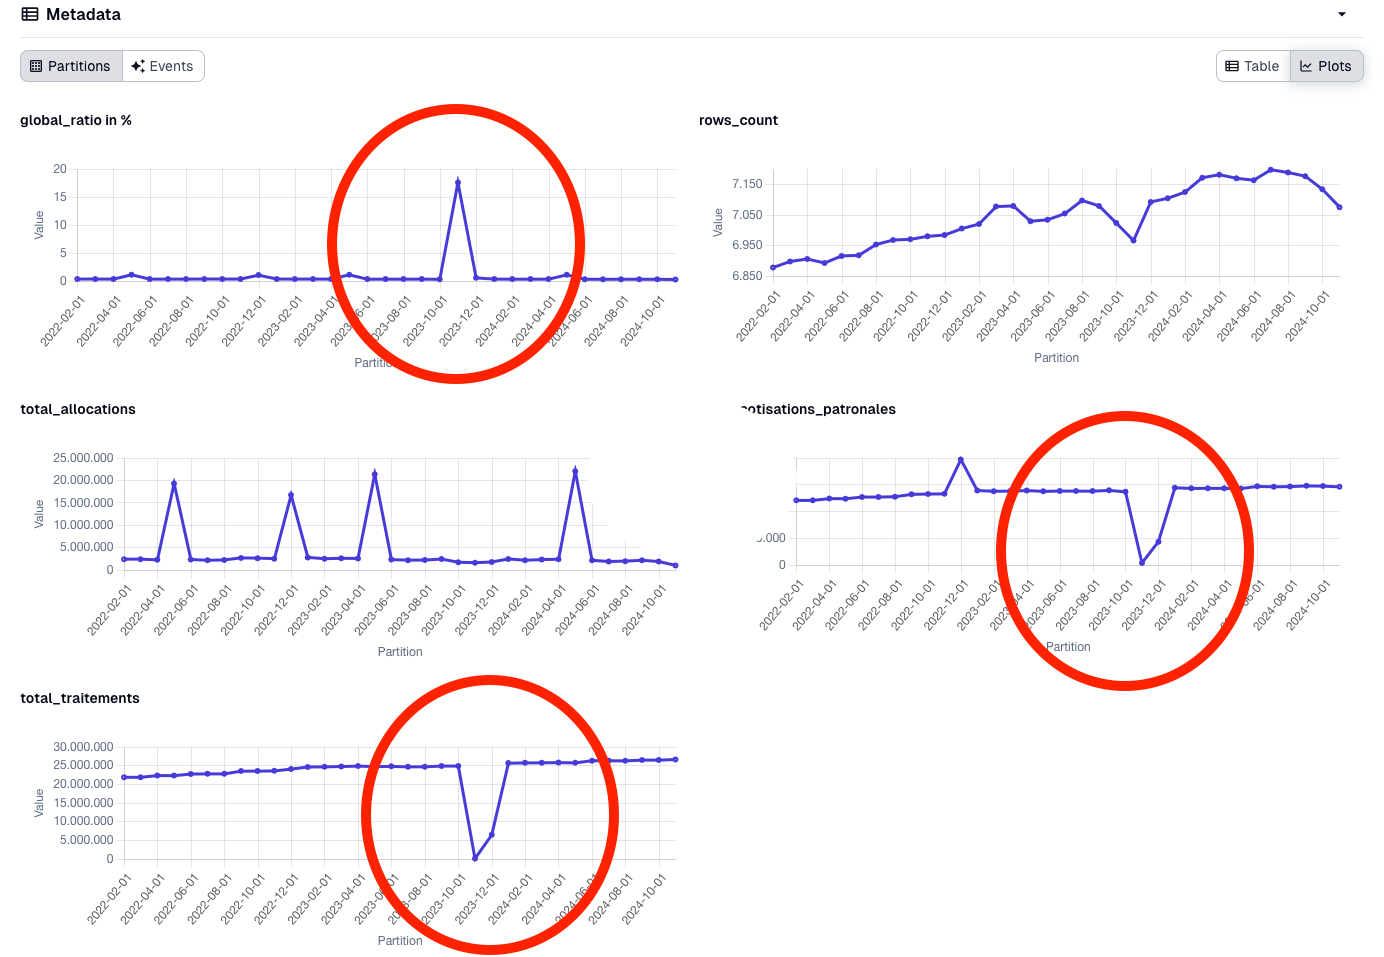
How observability feature helped us to detect quality issues
In this article, we have explored how to automate the deployment of data pipelines in a polycephalous organization like the FWB. We have seen how to use Dagster as an orchestrator, dbt-core for data transformations, and GitLab CI/CD for automating the deployment process.
We have also discussed the importance of modularity and reusability of components to lower the technical barrier for data analysts and data stewards. By automating the deployment process, we can ensure that every commit is tested and validated before being deployed to production, which encourages participation from data analysts and data stewards in the development of data pipelines.
But as stated in the introduction, the level of participation is inversely proportional to the technical barrier. The more complex the setup, the less likely data analysts and data stewards will participate in the development of data pipelines.
In the next article, we will explore how to lower the technical barrier even further by providing a user-friendly resources for data professionals to interact with the data platform. We will also discuss how to improve data literacy among data analysts and data stewards to encourage them to participate in the development of data pipelines.