Appearance

Executive summary: In a polycephalous organization, Data Governance is a complex challenge. This article explores the implementation of a Data Platform based on Dagster for the Fédération Wallonie-Bruxelles (FWB). It highlights the importance of automation, modularity, and component reusability to lower the technical barrier and improve data literacy among data analysts and data stewards.
The views expressed on this website are my own and do not necessarily reflect the views of my employer.
Table of contents
🏛️ Background
The French Community of Belgium (or Fédération Wallonie-Bruxelles, FWB) refers to one of the three constituent constitutional linguistic communities in Belgium.
The French Community of Belgium includes ~4.5 million people and its administration is responsible for the management of education, culture, sports, youth care, international relation, etc. for the French-speaking population of the country. The administration itself employs more than 7 000 people but the number of employees in the public sector that directly depend on the FWB is much much larger mainly due to the education and child care sectors.
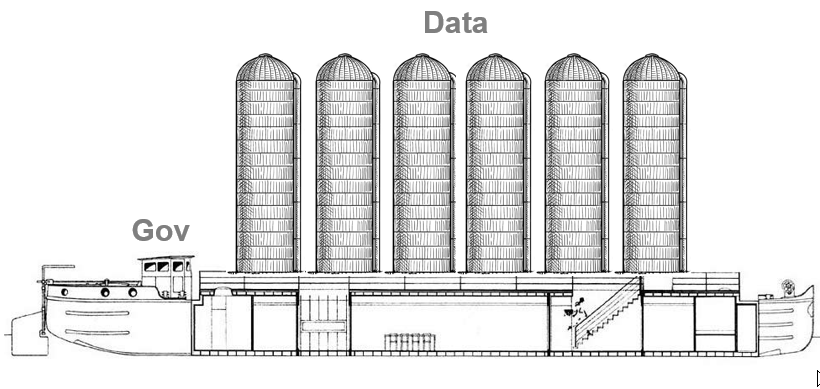
The Ministry of FWB (MFWB) is a complex organization with multiple entities called "Administrations générales" (or AG). Each of these entitie manages its own data — often in silos — and has its own governance structures composed of various layers of Services and Directions with Project Managers, Product Owners, Business Analysts, ...etc. Under this organisational complexity, the technical landscape is of course also complex. Each AG has its own products, Applications, DBMS, DWH, BI tools, etc. This leads to a lack of consistency and quality in the data. The employees mostly use Microsoft products (Excel) for their data management and analytics needs. Very few people are trained in data management and programmation, which leads sometimes to a lack of data literacy and understanding of the importance of data governance.
This polycephalous nature of the organization makes it challenging to govern and implement a unified data platform that meets the needs of all stakeholders.
🎯 What is our data strategy?
The data strategy of the French-speaking Community of Belgium (FWB), known as "Données au Centre," has been in place since 2020 and aims to enhance data management and exploitation to improve service delivery and governance.
Key elements of the strategy include:
- Assigning a Data Owner and Data Steward to each meaningful dataset to ensure accountability and proper management.
- Providing raw access to datasets for authorized personnel, while adhering to mandatory legal compliance requirements.
- Offering technical and non-technical training to Data Owners and Data Stewards on topics such as data indicators, visualization, governance, Python, and SQL to enhance their data handling skills.
- Cultivating a data-centric culture (Données au centre) through comprehensive documentation, training, and regular community meetings to encourage effective use of data resources.
The strategy outlines objectives focusing on improving data quality, availability, and security, and fostering collaboration across organizational boundaries. It seeks to identify strategic data assets crucial for ministry operations, develop strategic and operational dashboards for informed decision-making, and promote data sharing and reuse beyond organizational barriers.
Additionally, the strategy prioritizes GDPR compliance for personal data, integration of reference data into business solutions, and publication of data through the Open Data platform to enhance transparency and accessibility.
📦 Where are the data?
In the context of this type of organization, raw data are collected from various sources, including databases, APIs, and flat files. The heterogeneous nature of these sources makes it challenging to ensure data access, quality, consistency — and hence exploitation. To address this challenge, a decision made years ago, was to implement a virtualisation layer (based on Denodo) on top of DBMS.
Denodo is a powerful tool for data virtualization, but it requires a certain level of expertise to configure and maintain. This can be a barrier for some teams, especially those with limited technical resources. It is also not 100% compliant with most SQL standards (Denodo VQL), which can lead to confusion and errors when working with the data (accross upstream and downstream systems).
While data virtualisation helps to unify the data access, it also adds complexity to the architecture by providing a new layer. Moreover, it does not solve complex transformations, load processes, and data quality monitoring issues. This is where the data platform comes into play.
🏗️ Conceptual architecture of a data stack
Starting from raw data (or sometimes virtualised data), the Ministry need to analyse, transform and move data into a format that is suitable for exploration, analysis and/or exploitation.
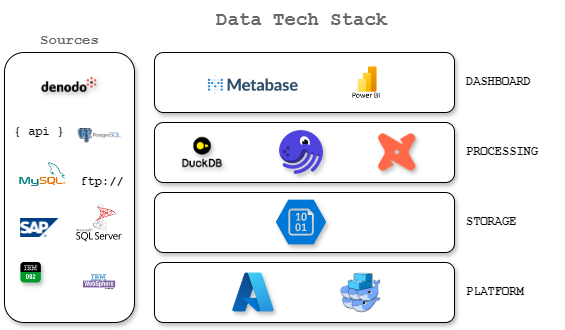
A data stack is usually composed of several components that work together to manage and process data. The specific components of a data stack can vary depending on the needs of the organization, but they typically include:
- Sources: These are the systems and applications that generate and store data. They can include databases, APIs, flat files, and other data repositories.
- Platform: This is where the compute is done to process and analyze data. It can include cloud-based platforms, on-premises servers, and other computing resources.
- Storage: This is where data is stored for later use. It can include databases, data lakes, and other storage solutions.
- Processing: This is where data is transformed and prepared for analysis. It can include ETL (Extract, Transform, Load) processes, data pipelines, and other data processing tools. This also includes ML and AI processes that can be used to analyze and extract insights from data.
- Dashboard: This is where data is presented in a way that is easy to understand and analyze. It can include dashboards, reports, and other visualization tools.
Our data stack currently includes several components:
We also tried several tools before settling on what we have today. The goal was to find a solution that would be flexible, auditable, transparent, and scalable. By "auditable", we mean a system where every action and modification can be tracked, logged, and reviewed to ensure accountability and compliance.
We also wanted to avoid vendor lock-in 🔒 and ensure that the solution could be adapted to the needs of the organization and the level of technical expertise of the users.
Based on those requirements, in terms of orchestrators, we tried Airflow for a few weeks and relied on Prefect for a few months. We then decided to switch to Dagster, for a set of reasons:
- Data observability features at the core of the architecture -- this is a key requirement for us ;
- Separation of code location to match the strong decentralized nature of the FWB ;
- Great community and unified qualitative documentation ;
The new architecture includes a data platform that integrates with existing data sources and tools, providing a more streamlined and efficient approach to data management.
Based on our context and choices, implementing a successful data orchestrator for the FWB hinges on two key challenges: easy onboarding and data literacy of our users. To achieve this, we need to focus on the following aspects:
🤖 Automate everything (or almost) : facilitate the onboarding
Developing a piece of software like a data platform is a complex task that requires a lot of time and effort. To make it easier for users to onboard and use the platform, we need to focus on automating as much of the process as possible. Here's an overview of our automation strategy:
- Automating testing: Implementing comprehensive testing from unit tests to integration tests
- Automating deployment: Multi-environment deployment pipeline (testing, staging, production)
- Automating integration: Seamless connection with existing FWB systems
- Automating monitoring: Proactive pipeline and data quality monitoring
💡 For a detailed dive into our automation implementation, including GitLab CI/CD configurations and Dagster asset examples, check out Part 2 of this series.
📚 Data Literacy : Lower the barrier and give power to the users
As most of our users are not trained data professionals, we've developed several strategies to make the platform more accessible:
- Technical barrier reduction: User-friendly interfaces and workflows
- Core resources development: Reusable components and templates
- Best practices framework: Clear standards for coding, testing, and deployment
- AI integration: Leveraging AI for pipeline development assistance
- Modular code architecture: Independent code locations for reduced complexity
💡 In Part 3 of this series, we'll explore how our custom resources have enhanced data governance and made the platform more accessible to users of all technical levels.